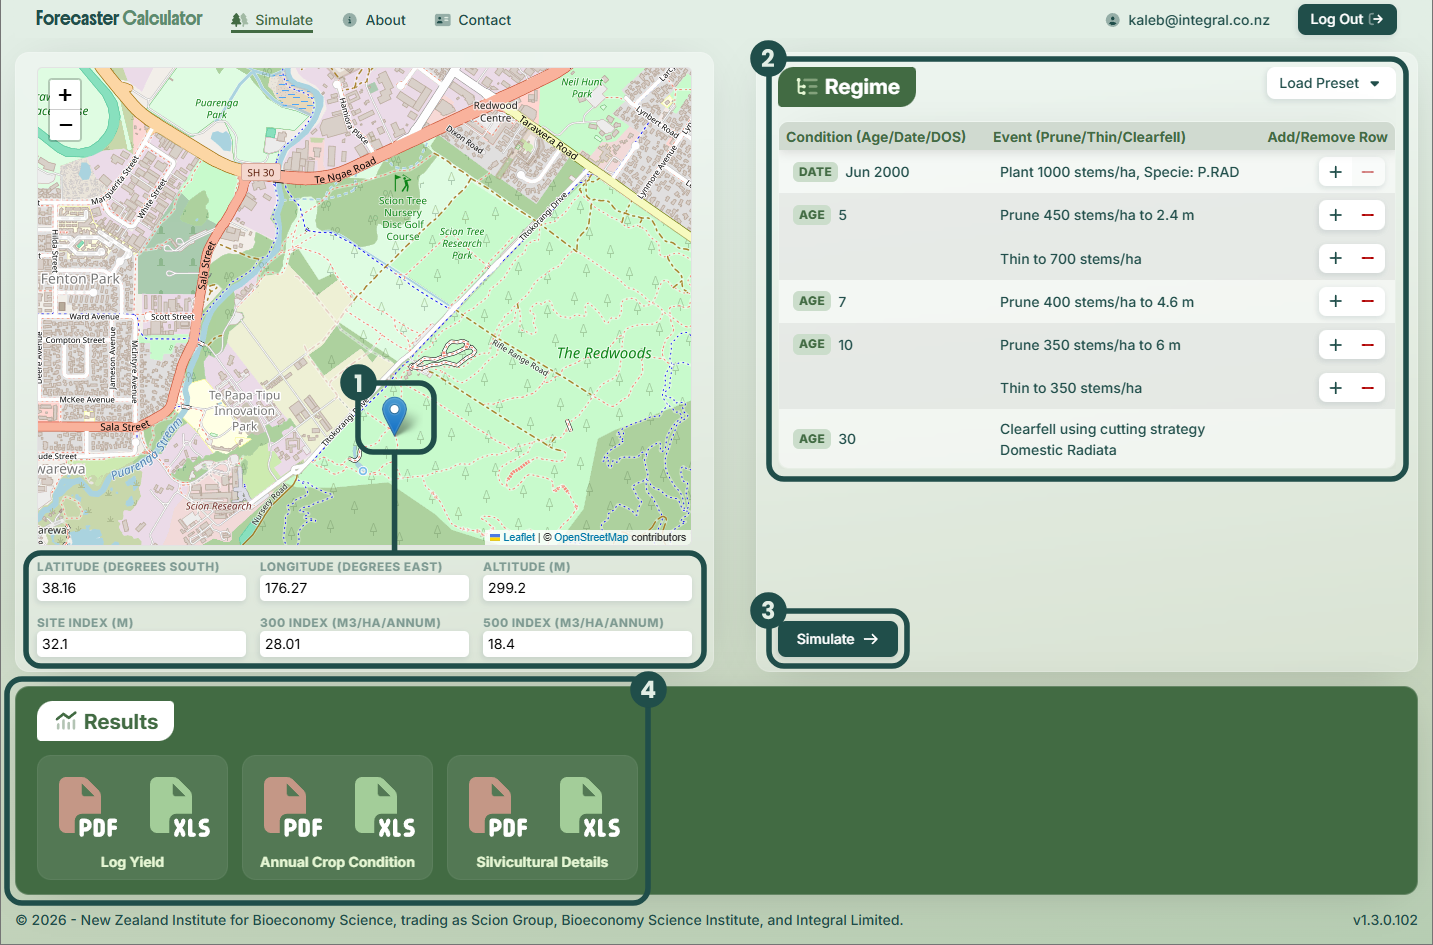
Pan and zoom the map to find your forest. Click the map to reposition the marker. The site information below the map will update automatically.
Note: If you are working with Douglas-fir, the 500 index will need to be manually calibrated.
Initialise the regime
Click Load Preset to initialise the regime with some preset conditions. From there, adjust the conditions and events, edit event details, and reorder items as needed.
Run the simulation
When you are satisfied with the site details and regime, click Simulate.
Download the results
After the simulation finishes, the results will be available to download from the Results section. Each report is available in Microsoft Excel (.xlsx) and PDF format.
About Forecaster Calculator
Forecaster Calculator provides similar functionality to the Radiata Pine Calculator and the Douglas-fir Calculator. The calculator is designed primarily for small woodlot owners and early-stage planning. It uses the same growth-and-yield modelling engine as Forecaster desktop, presented through a simpler workflow with sensible defaults. This makes it useful for exploring and comparing different regimes or harvest ages.
That said, it is a simple forest simulation tool designed for Radiata Pine in New Zealand. For Douglas-fir, there is no productivity surface and you will need a specific measurement event to calibrate the model. It simulates the tree growth and the log products produced at a single clearfell age on a per hectare basis.
Unsure if this is fit for you?
It is generally geared towards small woodlot owners wishing to calculate a rough estimate of the volume and log product mix on a particular site at a particular age. If you would like a more accurate estimate, you can take detailed plot-based stem measurements pre-harvest, and input those measurements into a pre-harvest forest inventory tool such as YTGen.
How it differentiates from Forecaster desktop
The Forecaster Calculator is built using the same set of models as the Forecaster desktop application which is widely used by the Forest Industry for yield table generation (i.e. log product volumes by age), regime evaluation and silvicultural scheduling.
The simplified interface of the Forecaster Calculator does not support the range of settings and options that the Forecaster desktop application provides. However, to drive Forecaster Calculator a series of “smart” defaults are used which are intended to reflect standard silvicultural regimes on normal farm/forestry sites, planted with commonly-used stock.
If you are interested in using Forecaster desktop, contact us.
Technical Information
Site Selection
Forecaster calculator works by utilising geographic location. When you select a point on the map, Forecaster Calculator will cross reference it with a number of geographic “surfaces” which predict some growth-related parameters based on the location. These include:
Altitude (metres above sea level).
Site index. For radiata this is the average height of the 100 largest diameter stems per hectare at age 20 years. (Goulding 2005).
300 Index. This is the stem volume mean annual increment (MAI) at age 30 years of a stand grown to a reference regime with final stocking of 300 stems/ha. (Kimberley et al. 2005).
Mean Annual Air Temperature. From Land Environments of New Zealand (LENZ) data.
Some of these “surfaces” have been developed by dividing the country up into a fixed sized grid and assigning values to each cell. Forecaster Calculator then averages non-missing surface values within a 15ha radius of the selected location. Site indices are applicable to tree stock with a genetic growth and form (GF) rating of 14.
Note that there is currently no surface for the 500 Index (which is required when simulating Douglas-fir) so a value must be entered. The article Douglas-fir - The Current New Zealand Scene, NZJF (Ledgard et. al. May 2005) has a table with some good starting values: South Waikato - 22.4, Rotorua-Taupo/East Coast - 18.3, Hawkes Bay - 14.6, Central North Island (Karioi) - 24.9, Lower North Island - 14.1 Nelson/Marlborough - 18.9, Westland - 16.6, Canterbury - 19.5, Otago - 19.7, Southland - 21.8. An overall average for New Zealand is given as 18.4.
Model Selection
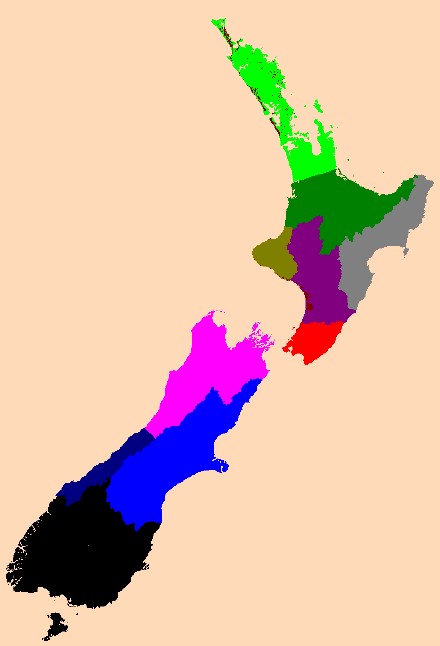
The models used are created using various national and regional defaults. The location of the site is used to determine the growth modelling region depicted in the image.
The stump height is set at 0.3 metres. This is the height above ground of the large-end diameter of the first log cut from the butt piece of each stem. The generic sweep and forking models are used, with parameters derived from the study by Snook (Snook 2013). No models are specified for carbon, wood density, stiffness, heartwood, BIX, MFA or spiral grain. The Blossim branch model is selected with parameters for large branch probability and scale described by Snook (op cit).
According to the growth modelling region a monthly growth adjustment (for within-year growth patterns) is set. The Blossim branch model is also informed of the growth modelling region and the regional drift factor for the 300 Index growth model is determined.
The radiata pine growth and yield models used are: 300 Index growth model, Mean-top-height / Age = 112, Tree volume table = 471, Tree taper table = 273, Tree felling breakage table = 1, DOS = DOS1999.
The selected site’s region determines the regional growth defaults used by the simulation models.
Regimes
The silvicultural regime is specified by a list of commands, each of which comprises a condition, such as the age of the stand, and a series of one or more events such as plant, prune, thin or clear-fell. As the calculator requires only the basic parameters for these events the following defaults are assumed:
Planting – stock is GF 14.
Pruning – pruning is to a prune height with the larger, taller stems selected in preference, the ordering strictness set at 3 to allow for some spacing considerations in the stem selection. The number of stems to prune is specified.
Thinning – only waste thinning is supported. The residual stocking is specified and stems are selected from the smallest DBH and Height with an ordering strictness of 3.
To run a regime in Forecaster Calculator, a measurement of the crop is required as the start-point for the growth projections. If a measurement event is not supplied then one is generated using the 300 Index growth model by using the supplied site index and 300 index. The date of this generated measurement event is calculated from the plant year and crop age at the first silvicultural event.
Log Product Definitions and Cutting Strategies
Eight log product definitions are used in Forecaster Calculator’s cutting strategy when simulating Domestic Radiata. These align with the set in the Radiata Pine Calculator spreadsheet. Six log product definitions are used with the Export Radiata cutting strategy. Four are used when simulating Douglas-fir.
Domestic P.RAD Cutting Strategy
Grade
Pruned
S1
S2
S3
L1
L2
L3
Pulp
Pruned
TRUE
Length min (m)
4.2
4
4
4
4
4
4
4
Length max (m)
5.5
5.5
5.5
5.5
5.5
5.5
5.5
5.5
SED min (mm)
300
400
300
200
400
300
200
100
Branch max (cm)
0
6
6
6
12
12
12
15
Price ($)
126
88
80
64
65
56
52
40
Export P.RAD Cutting Strategy
Grade
Pruned
A
AO
K
KI
KIS
Pruned
TRUE
Length min (m)
4.0
3.9
4
3.9
3.9
3.9
Length max (m)
6.0
7.9
12
7.9
5.9
5.9
SED min (mm)
420
300
420
200
260
140
Branch max (cm)
0
12
15
12
25
35
Price ($)
160
111
113
100
92
85
Douglas-fir Cutting Strategy
Grade
DS
CF+
CF-
Pulp
Length min (m)
3.1
3.1
3.1
3.1
Length max (m)
6.1
6.1
6.1
6.7
SED min (mm)
200
300
150
100
Branch max (cm)
7
15
15
50
Price ($)
160
110
90
40
The Cutting strategies for both the Radiata Pine and Douglas-fir have a cutting cost of $1.00. This ensures a long log is preferred to two shorts of equal total value. The bucking mode is set to maximum value, that is, each stem piece is cut to produce the mix of logs that will yield the maximum value. This is a reproducible strategy that aligns with the predictions made by most pre-harvest inventory systems such as YTGen.
Comparison with P.RAD Calculator v4.1
Structural (Framing) Regime
On an average site (site index 30, 300 index 26), this regime was constructed as follows:
Plant 1000 s/ha;
Thin at age 5.5 to 800 s/ha;
Thin at age 10 to 500 s/ha;
Clearfell at age 30.
The results in terms of the mix of log product volumes are shown below. Differences in the percent of TRV by log grade are listed.
Log Grade
Forecaster Calculator Volume (m3/ha)
% of TRV
PRad Spreadsheet Calculator Volume (m3/ha)
% of TRV
Difference
S1
6.8
1
54.3
7
-6
S2
330.3
40
154.9
19
21
S3
193.1
23
212.0
26
-3
L1
0
0
29
4
-4
L2
127.1
15
86.5
10
5
L3
80
10
91.7
11
-1
Pulp
90.3
11
200.8
24
-13
TRV
827.6
100
829.0
100
TSV
979
976
TSV = total standing volume inside-bark at age 30 (m3/ha). TRV = total recovered volume at age 30 (m3/ha).
The TSV values are very close as expected. The percentage recovered yield predicted by Forecaster Calculator was 85%, which is the average value suggested in the spreadsheet. The grade mix is similar apart from S2 and Pulp where Forecaster Calculator predicted more S2 volume and less pulp.
Clear-wood (Pruned) Regime
On the same site a pruned regime was constructed as follows:
Plant 1000 s/ha;
Prune 450 to 2.4m at age 5;
Thin at age 5.5 to 700 s/ha;
Prune 400 to 4.6m at age 7;
Prune 350 to 6m at age 10;
Thin at age 10 to 350 s/ha;
Clearfell at age 30.
Results are shown below.
Log Grade
Forecaster Calculator Volume (m3/ha)
% of TRV
PRad Spreadsheet Calculator Volume (m3/ha)
% of TRV
Difference
Pruned
146.3
21
180.8
26
-5
S1
6.5
1
6.5
1
0
S2
230.5
33
72.6
10
23
S3
84
12
136.9
19
-7
L1
0
0
32.3
5
-5
L2
68.2
10
92.5
13
-3
L3
81.8
12
64.2
9
3
Pulp
76
11
118.8
17
-6
TRV
693.3
100
705.0
100
TSV
827.2
828.9
TSV = total standing volume inside-bark at age 30 (m3/ha). TRV = total recovered volume at age 30 (m3/ha).
Forecaster Calculator predicted 84% recovery for this regime and, again, estimated more S2 volume than the spreadsheet.
Discussion
No attempt was made to tune the log mix proportions to any pre-conceived set. However such adjustment would be possible in Forecaster desktop by varying the parameters of the “quality” models, that is, branching, sweep and forking. For example, a higher probability of large branches will tend to reduce the proportion of S grades. Adjustments can also be made by varying the relative price /m3 of the log grades.
References
Kimberley, M.O.; West, G.G.; Dean, M.G.; Knowles, L.R. 2005: The 300 Index — a volume productivity index for radiata pine. New Zealand Journal of Forestry 50: 13–18.
Goulding, C.J. 2005: Measurement of trees, NZIF Forestry Handbook 4th Edition. NZ Institute of Forestry.
Snook, J. 2013: Recommendations to Calibrate Branch Size, Sweep and Forking within FFR Forecaster. Scion Report.
Ledgard, N; Knowles, L.R.; De La Mare, P 2005: Douglas-fir - The Current New Zealand Scene. NZ Journal of Forestry.